Contact
PHONE: (704) 387-5455
EMAIL: [email protected]
901 DAVE GIBSON BLVD
FORT MILL SC 29708
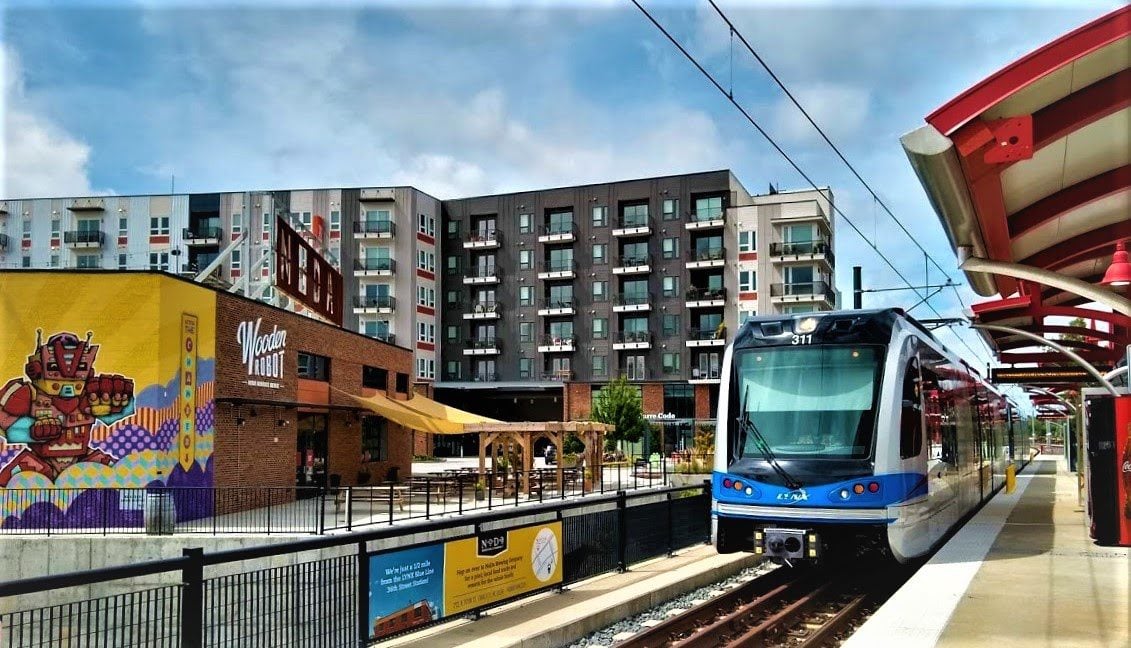
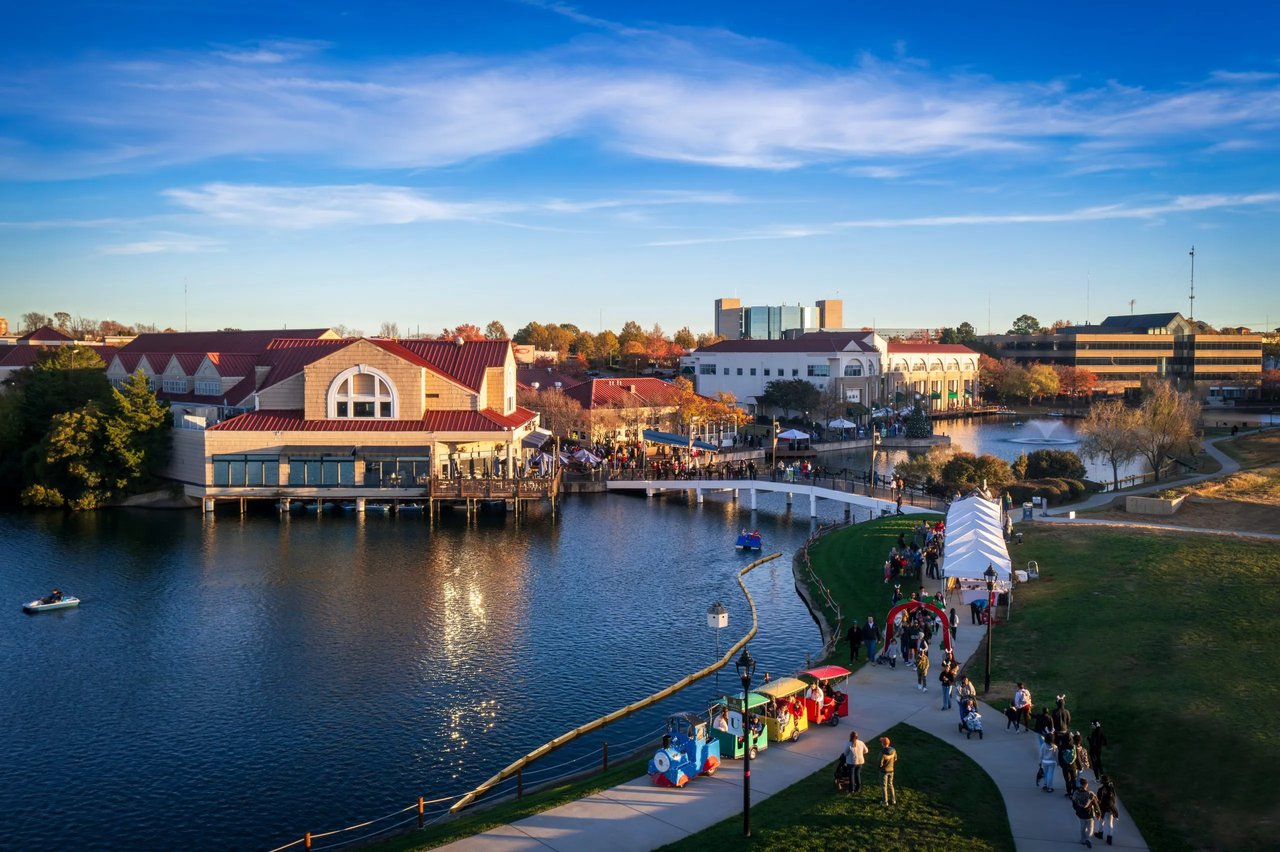
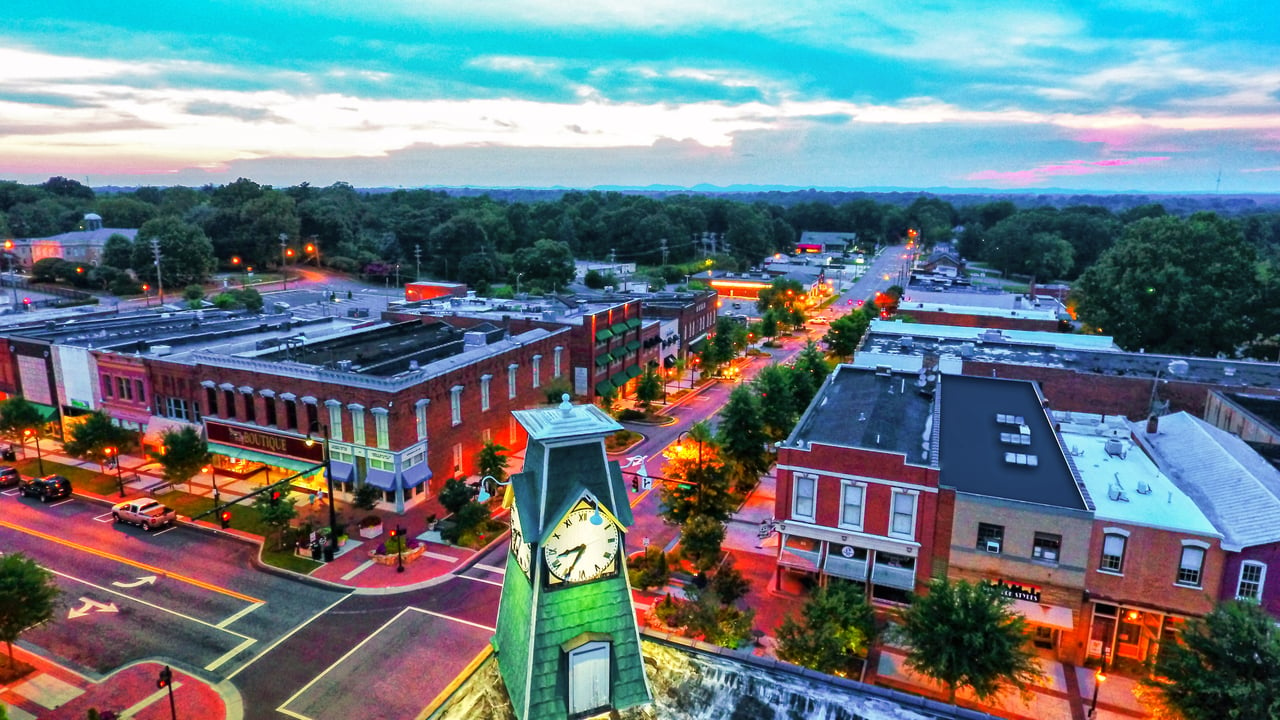
South End is one of Charlotte’s most vibrant and rapidly evolving neighborhoods—a shining example of how smart growth and intentional design can create a thriving urban community. Fueled by the success of Charlotte’s light rail system, South End has experienced explosive development over the past decade, transforming former industrial spaces into a walkable, lively hub of culture, commerce, and connection.
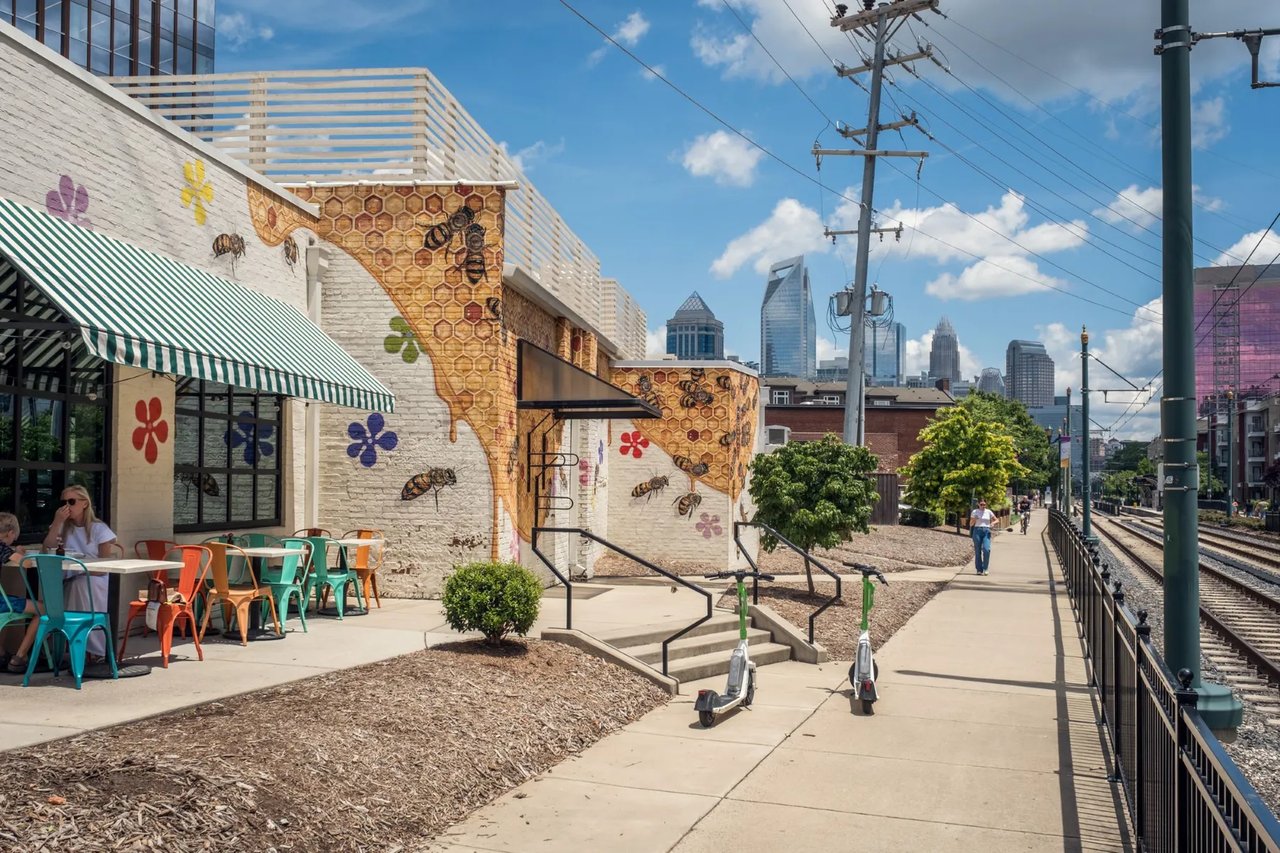
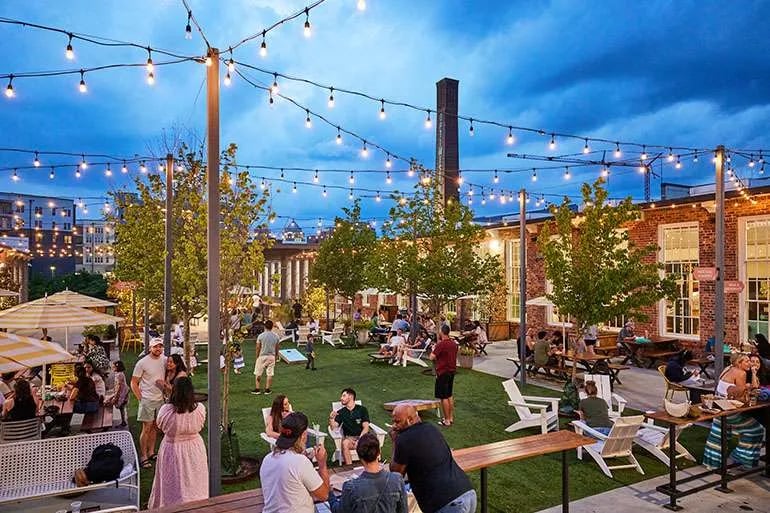
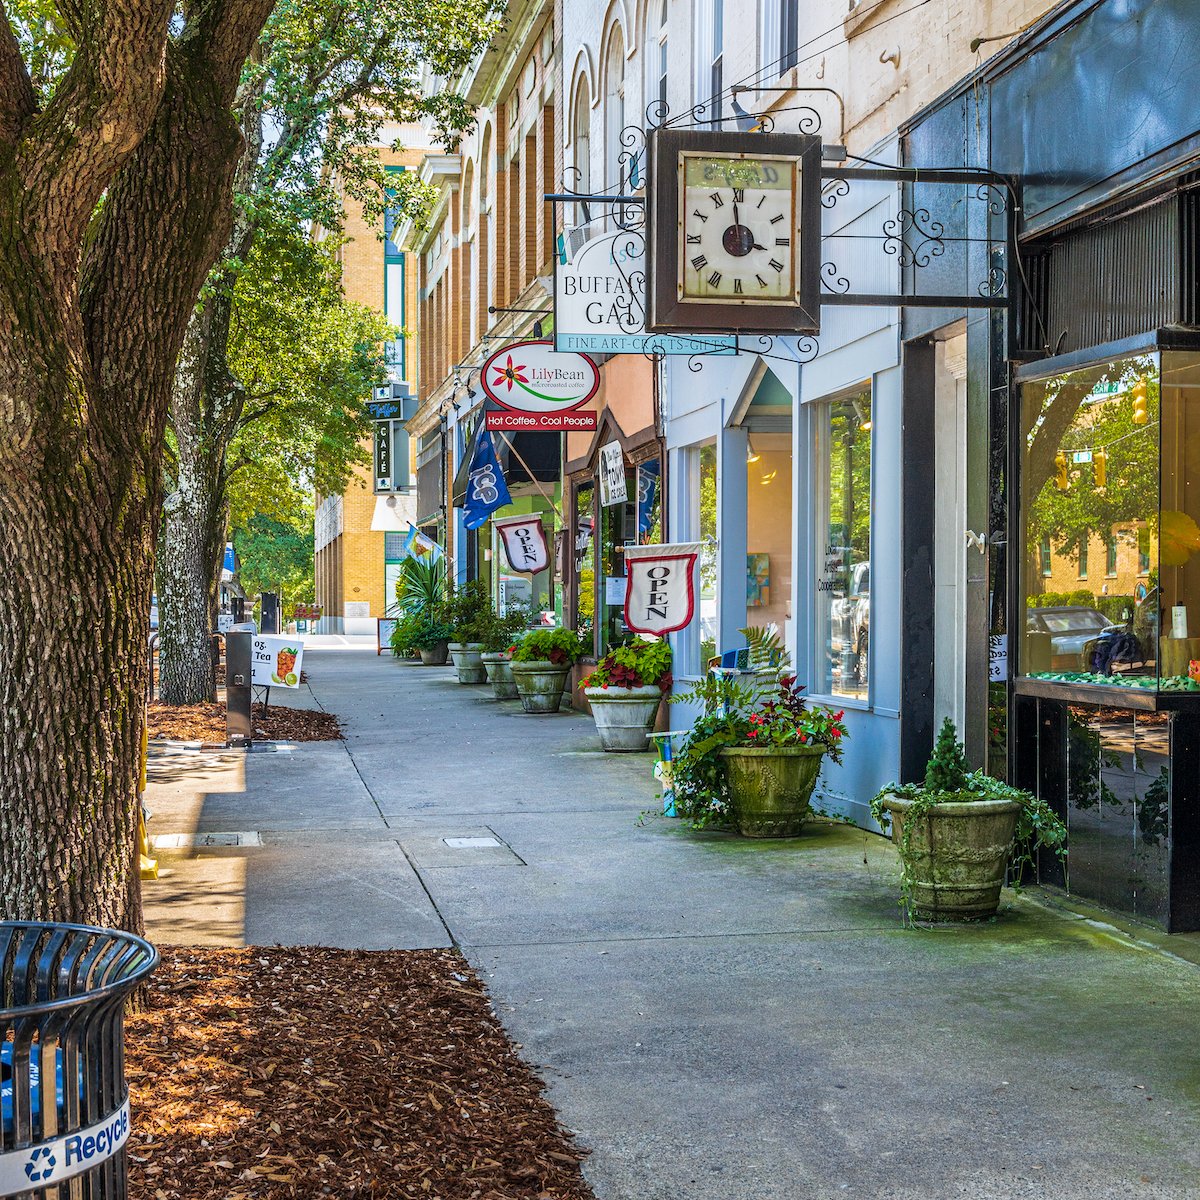
At the heart of the neighborhood is the beloved Rail Trail—a multi-use path that runs alongside the light rail, offering residents and visitors an easy, car-free way to explore the area on foot or by bike. Lined with art installations, outdoor patios, and people enjoying coffee or cocktails, the Rail Trail has become one of the most iconic features of South End.
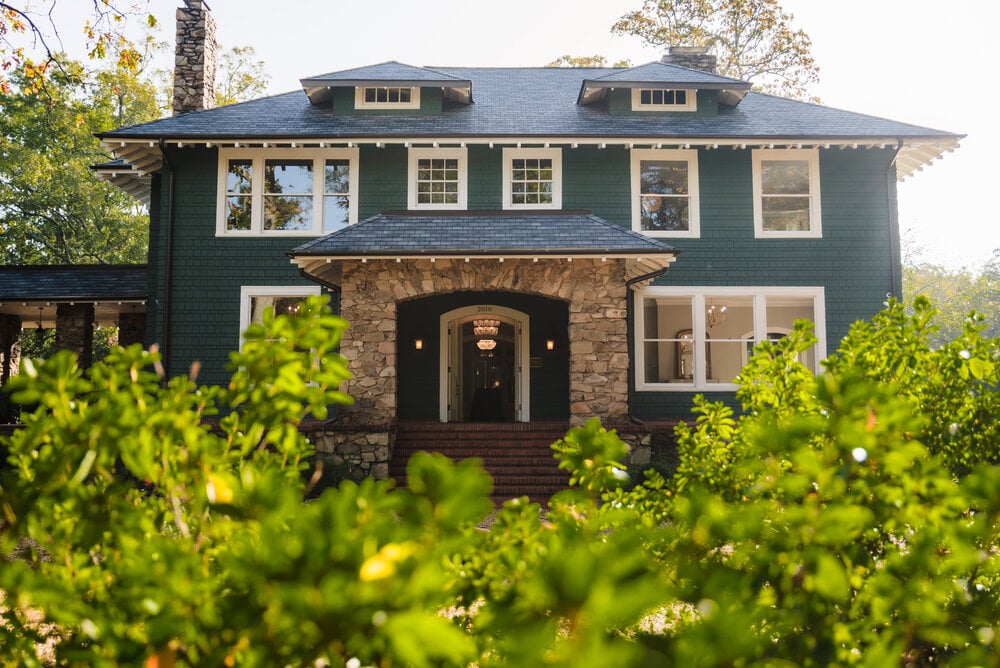
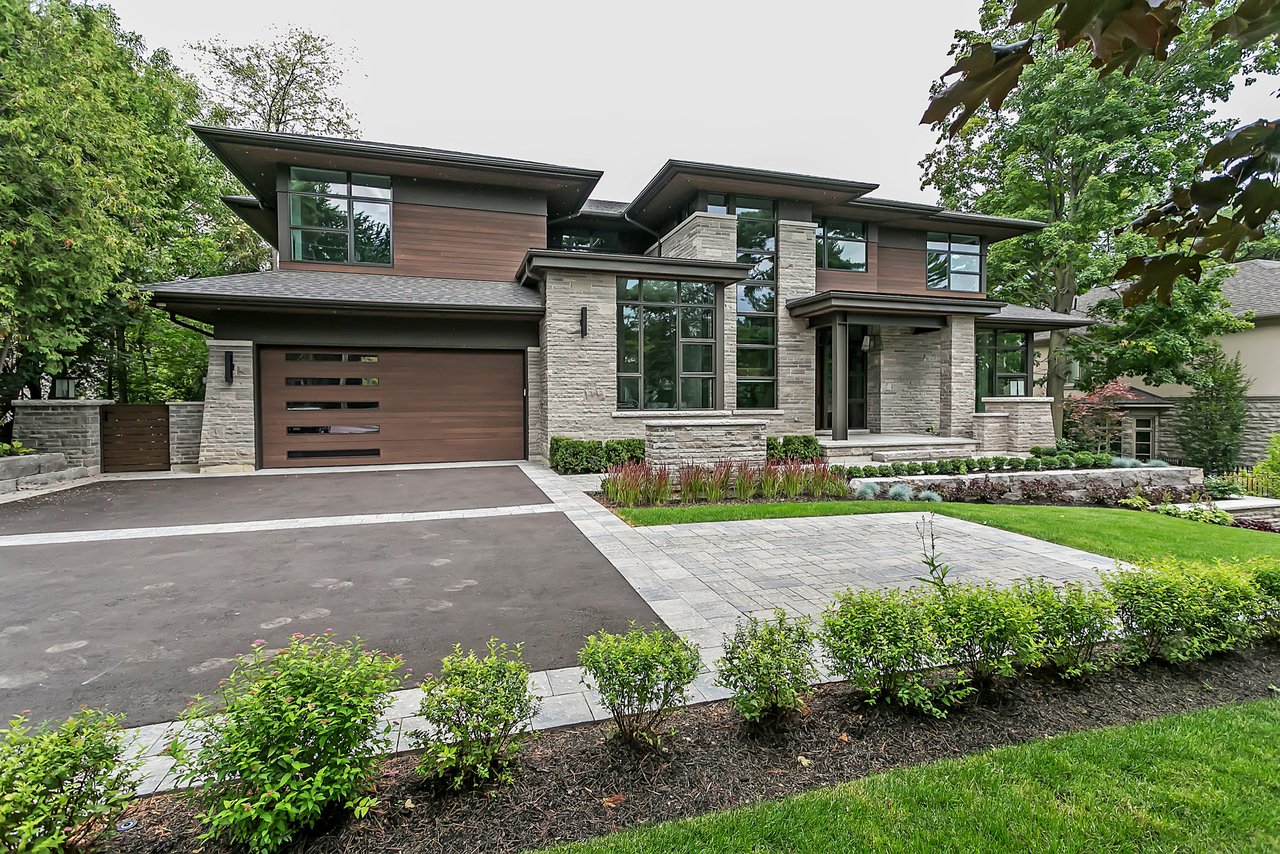
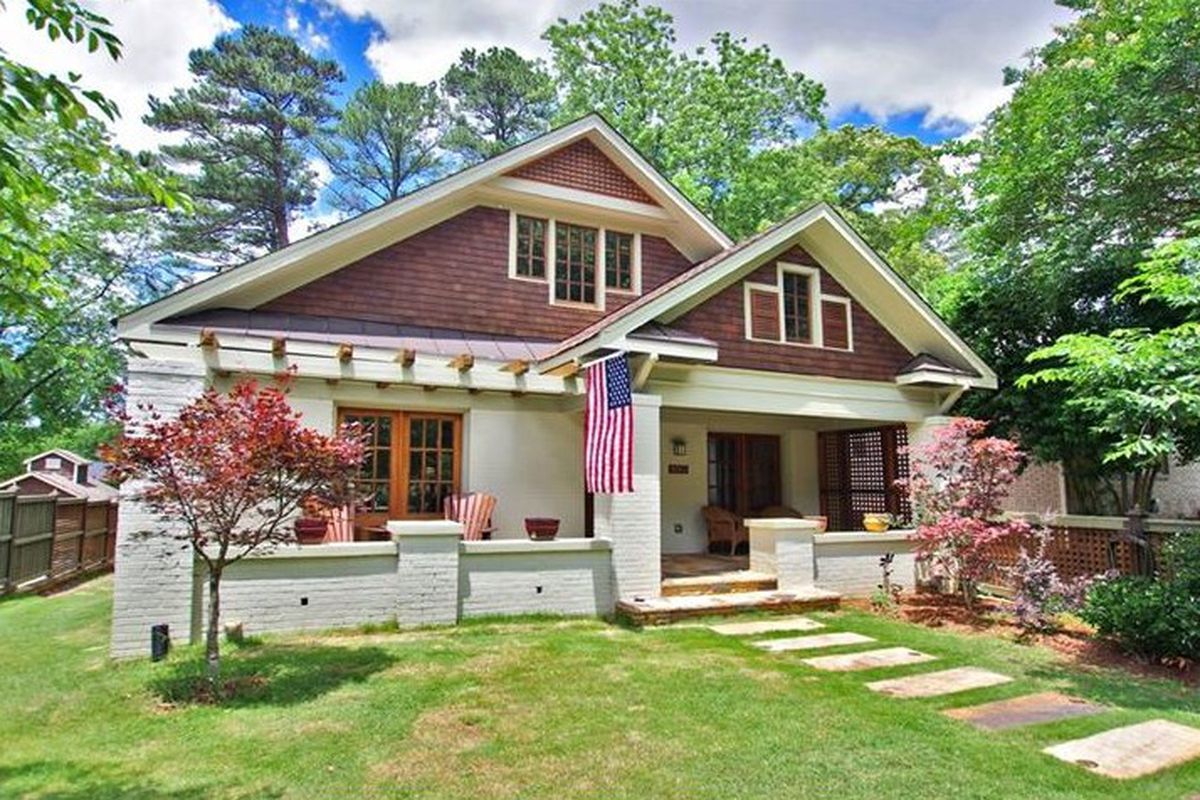
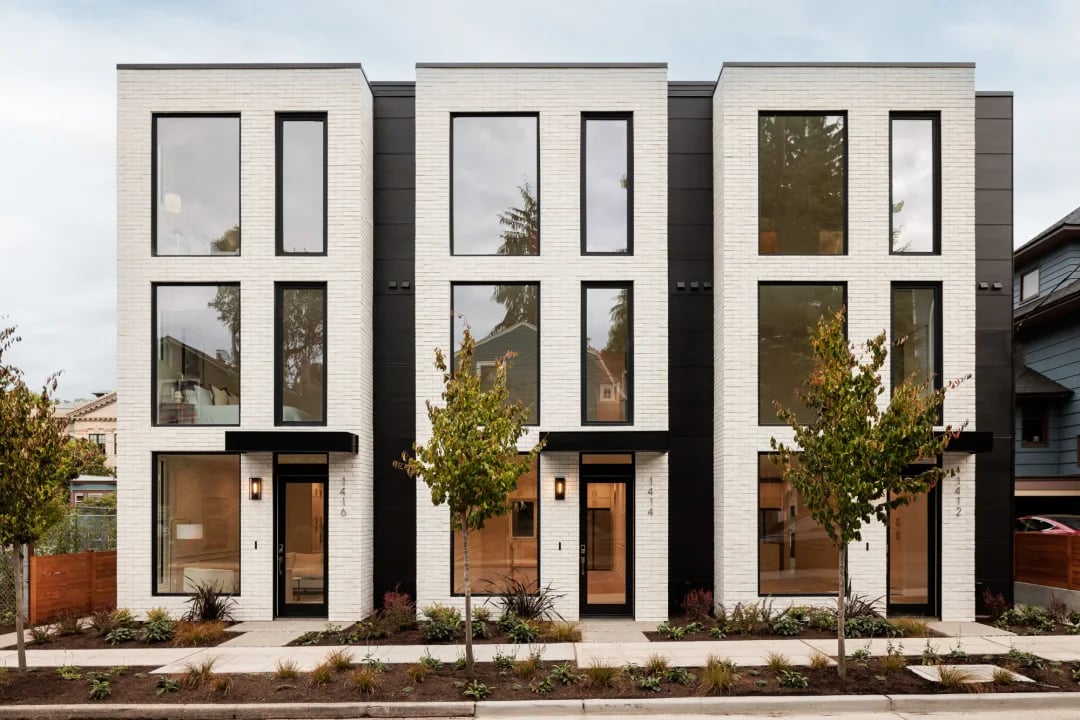
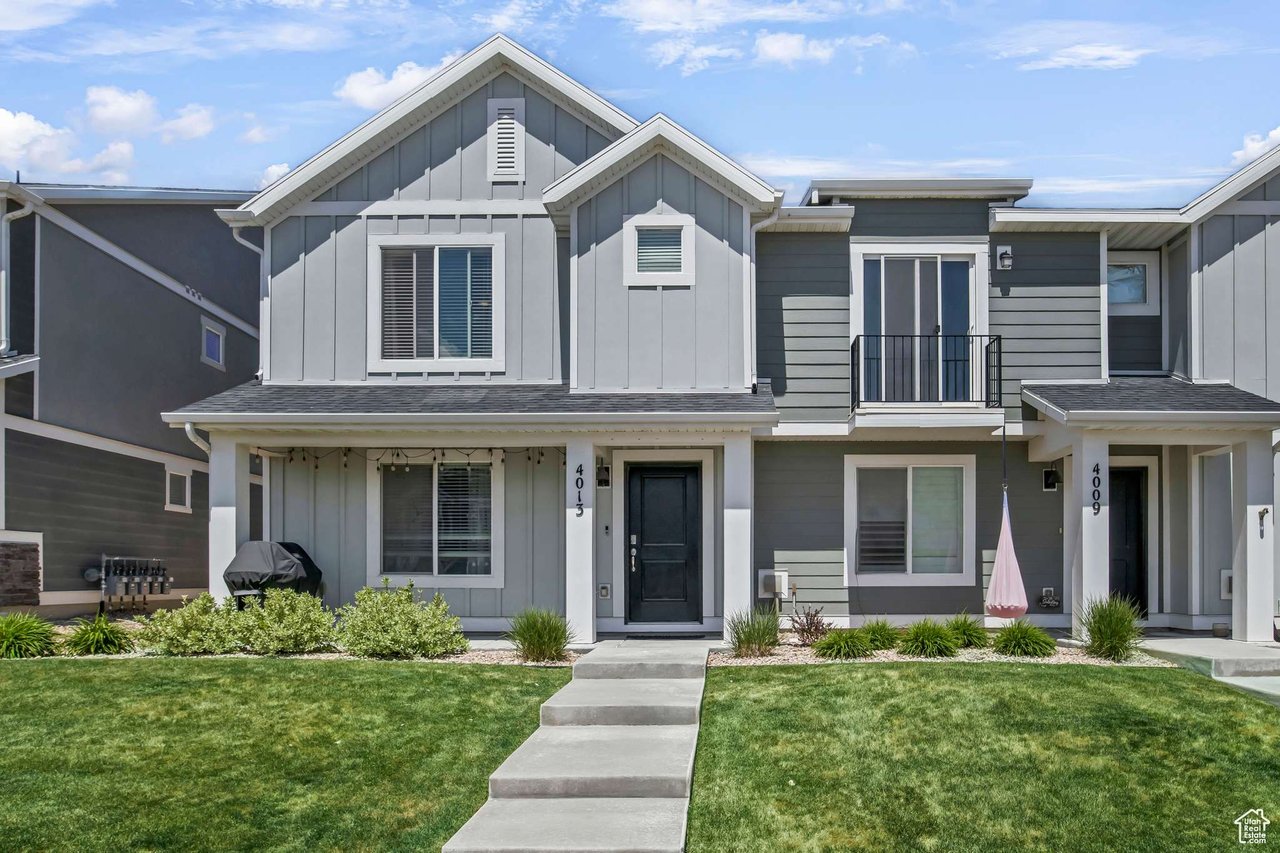
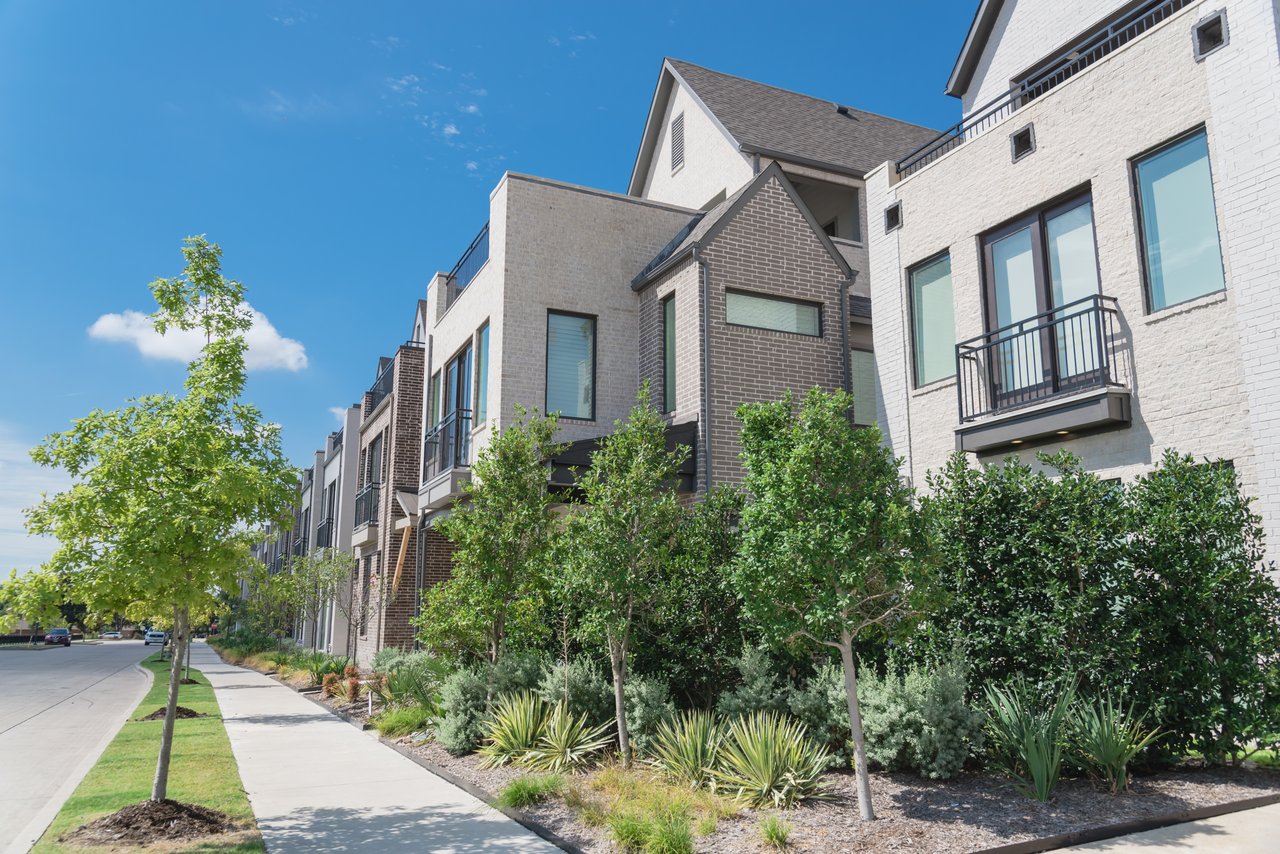
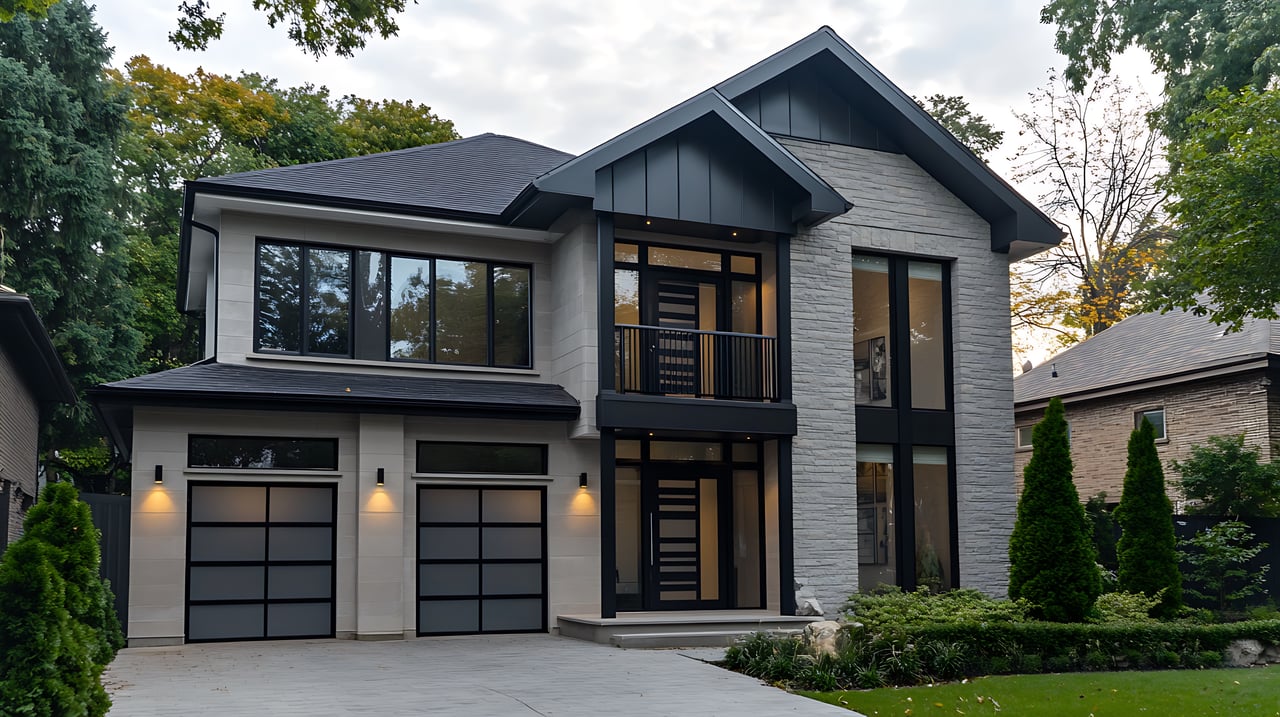
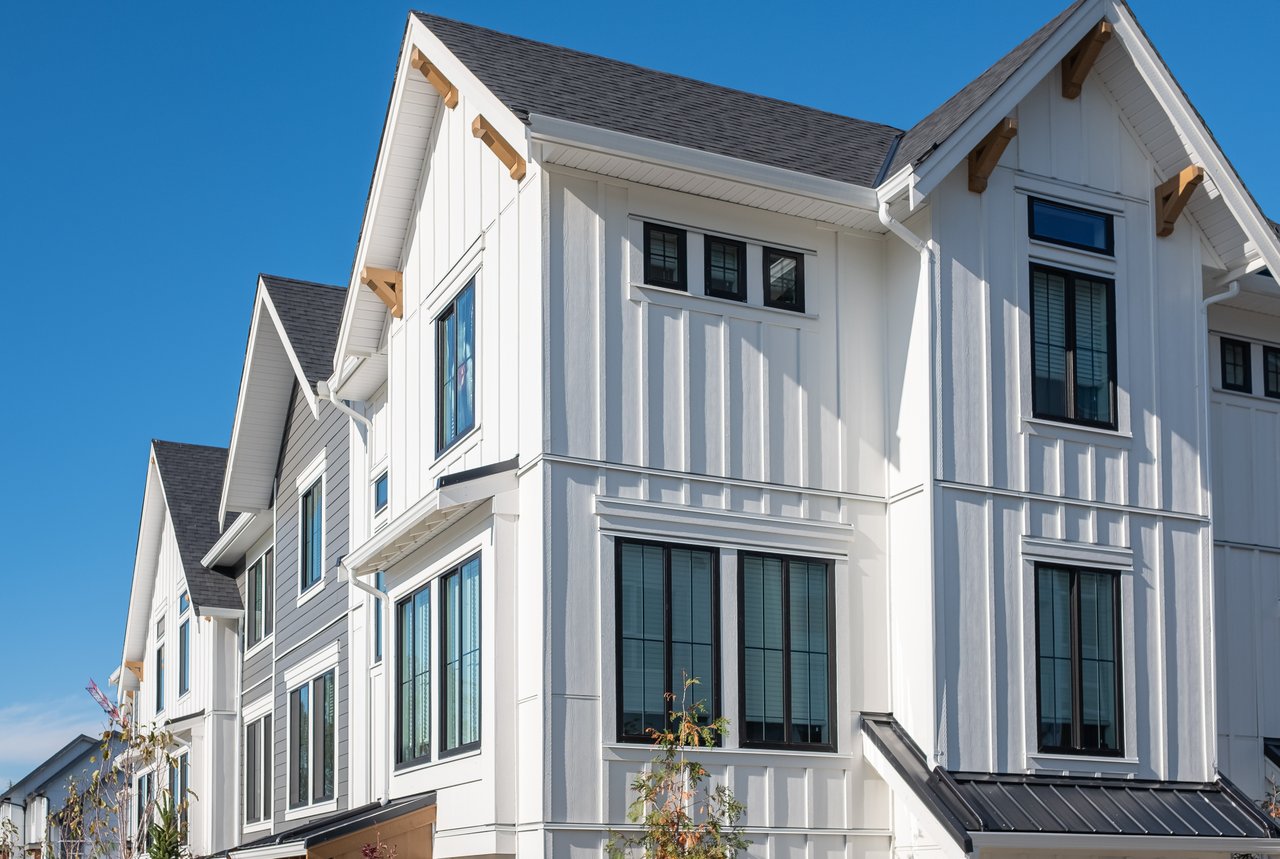
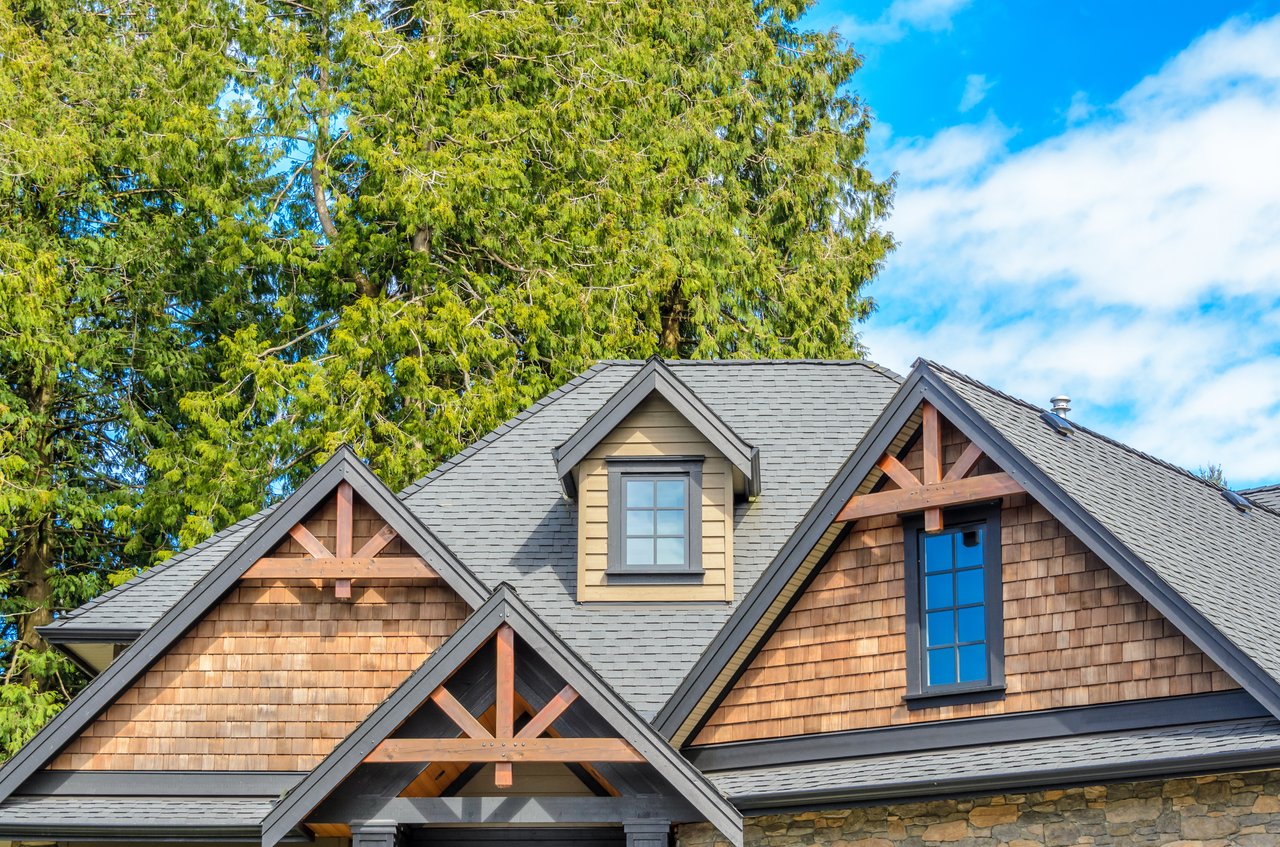
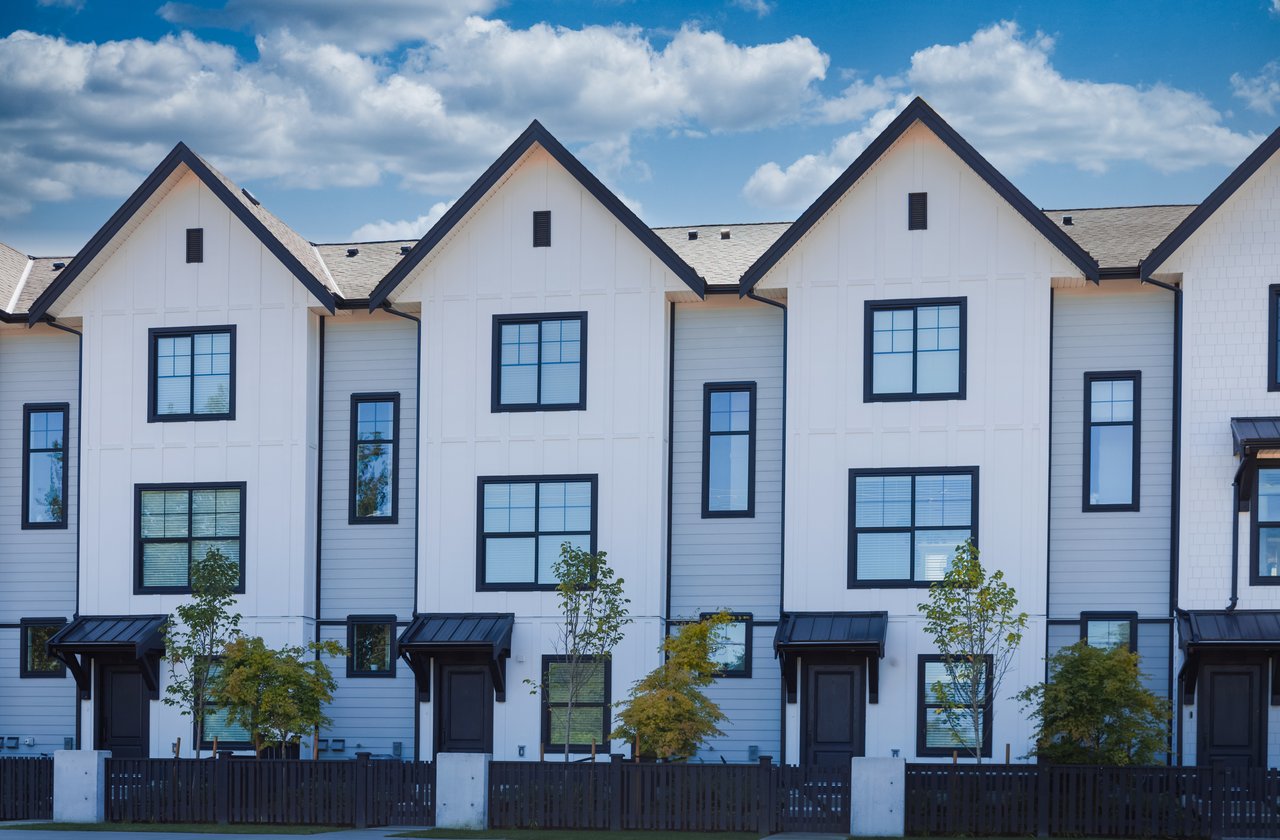
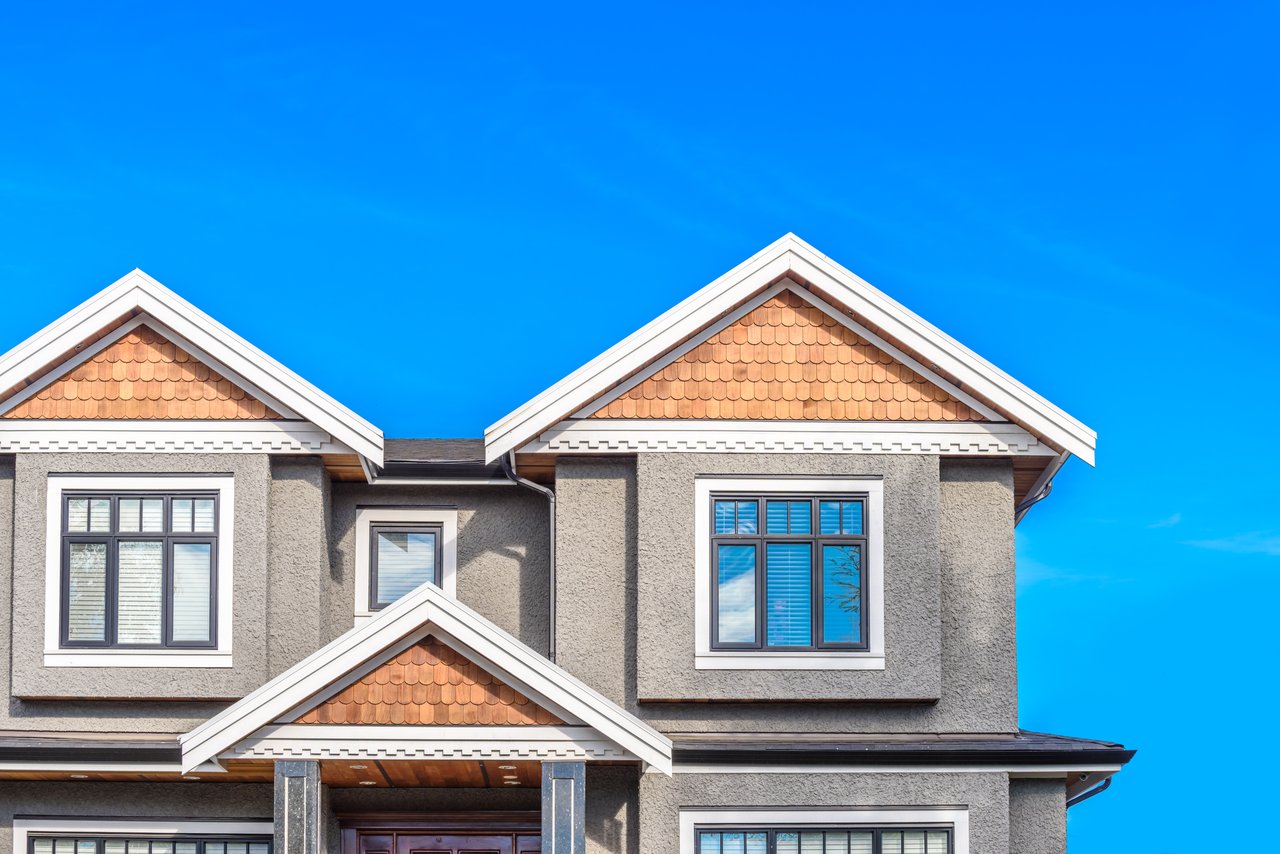
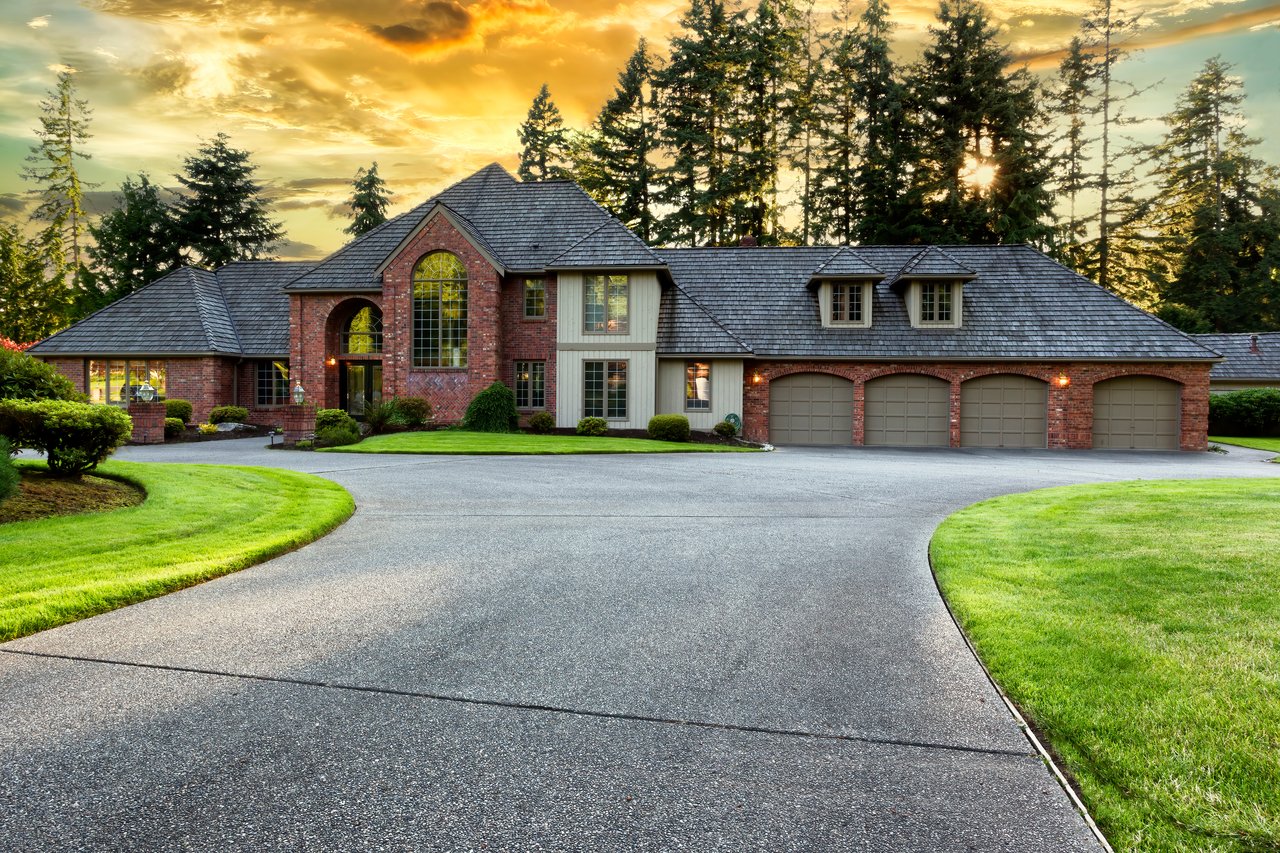
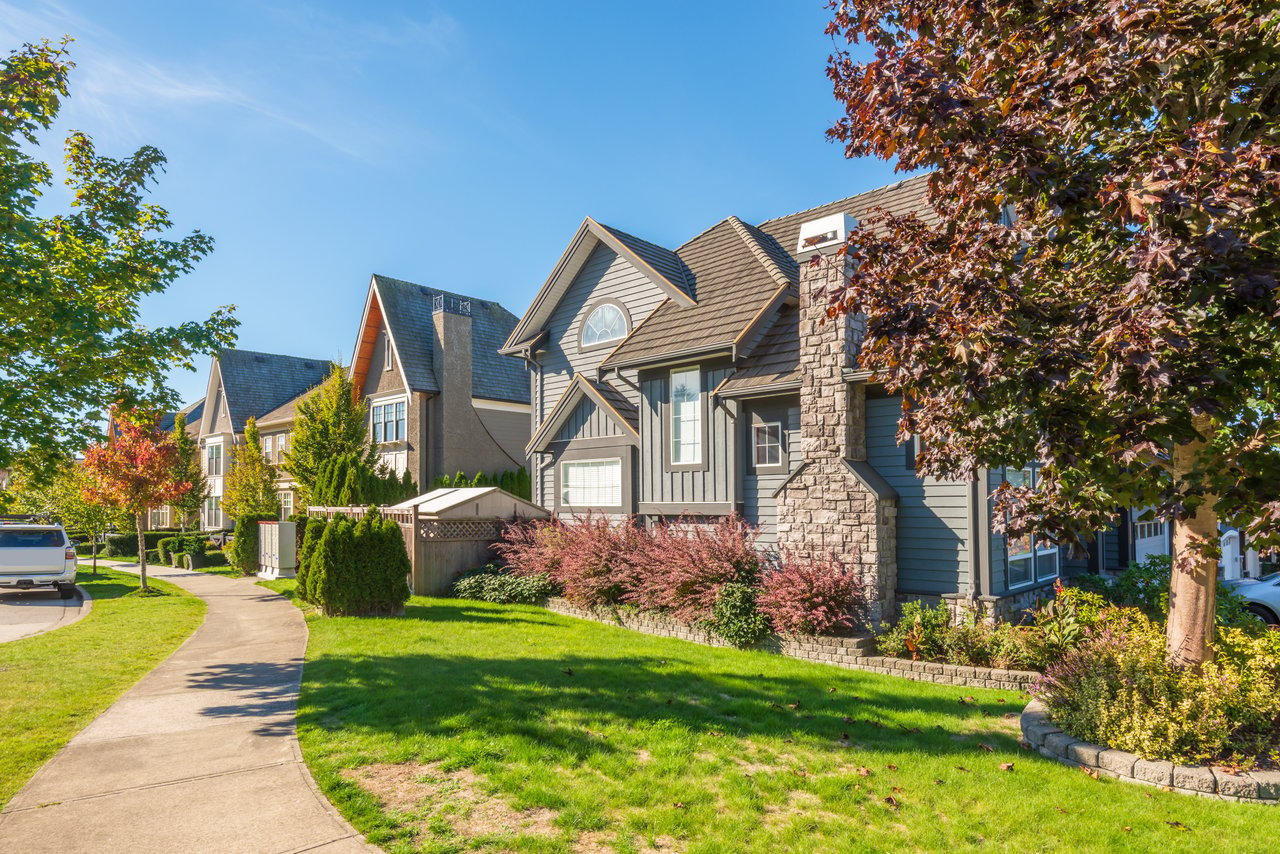
For homebuyers, South End offers a growing inventory of modern townhomes, luxury condos, and sleek new construction—perfect for those who want the convenience of city living without sacrificing style or space. The neighborhood appeals to professionals, creatives, and entrepreneurs who value a walkable lifestyle and easy access to both Uptown and Charlotte’s expanding trail and transit network.
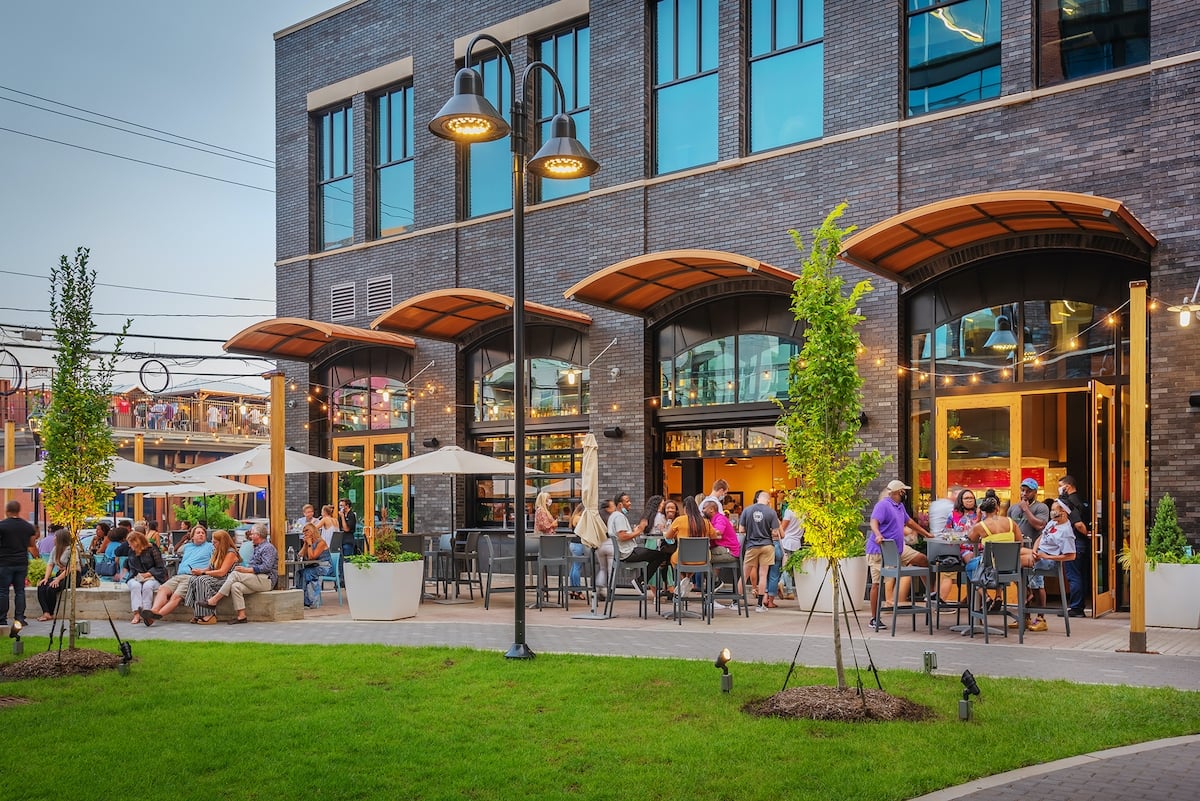
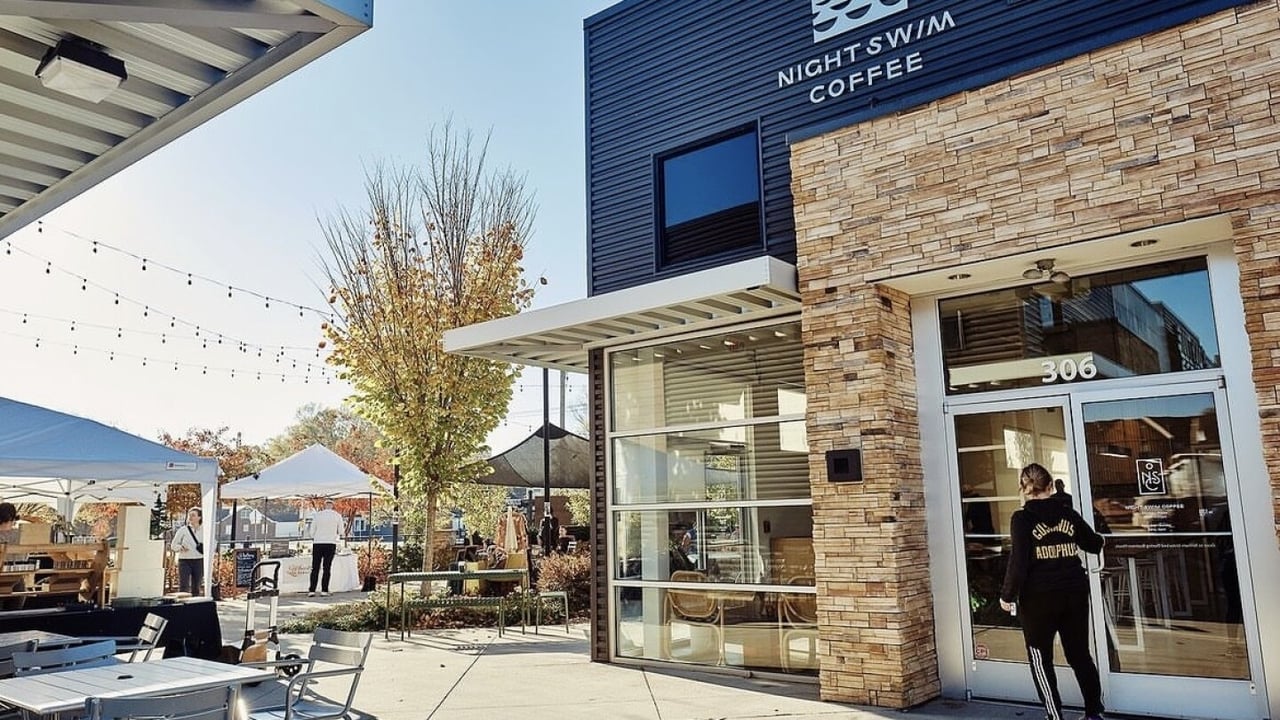
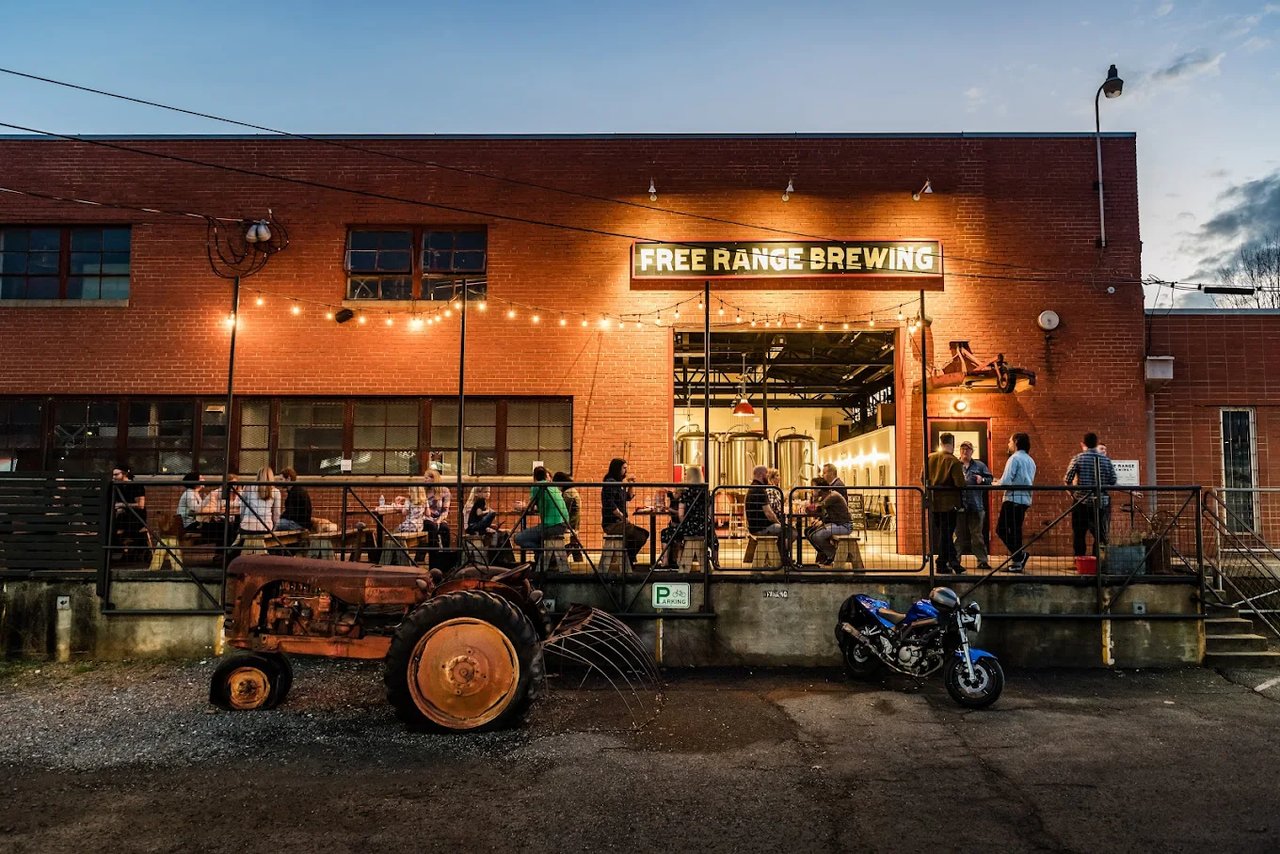
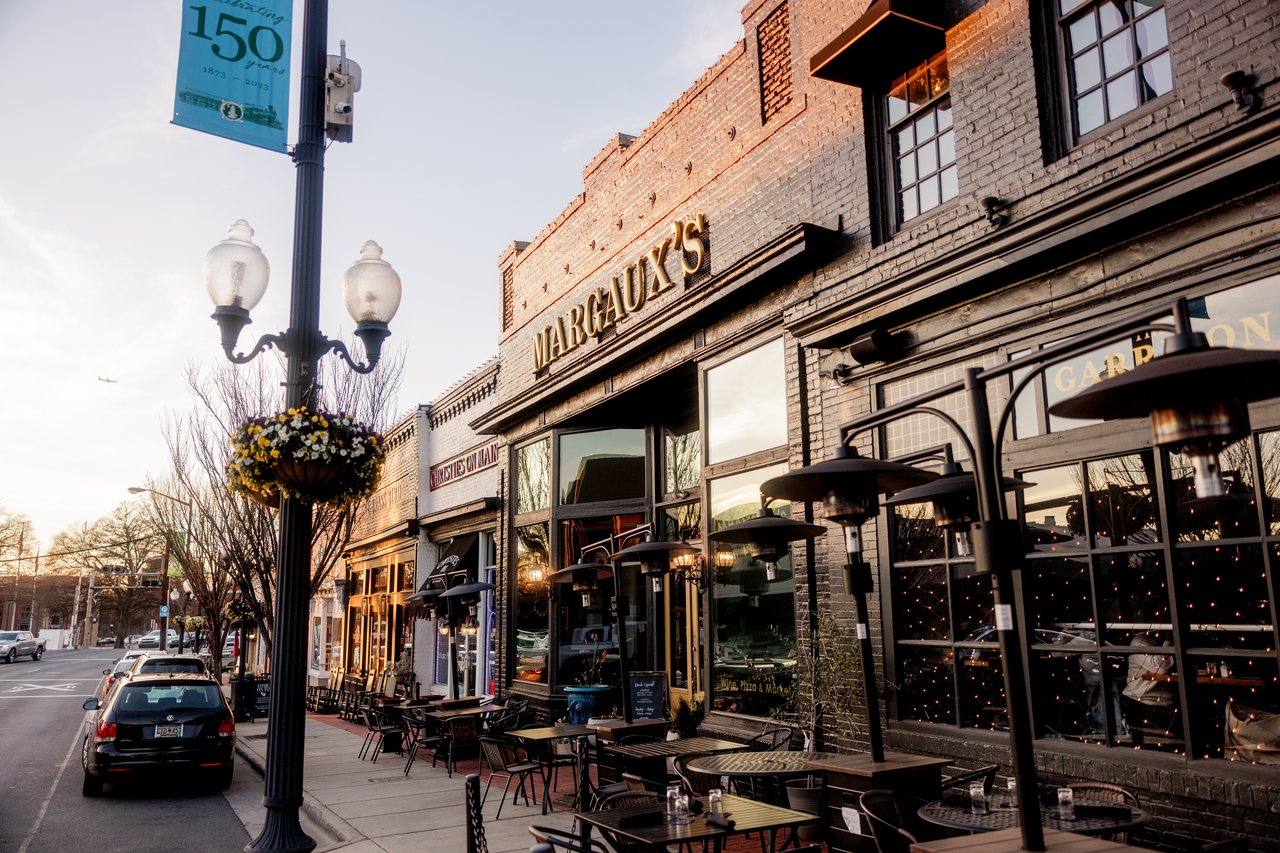
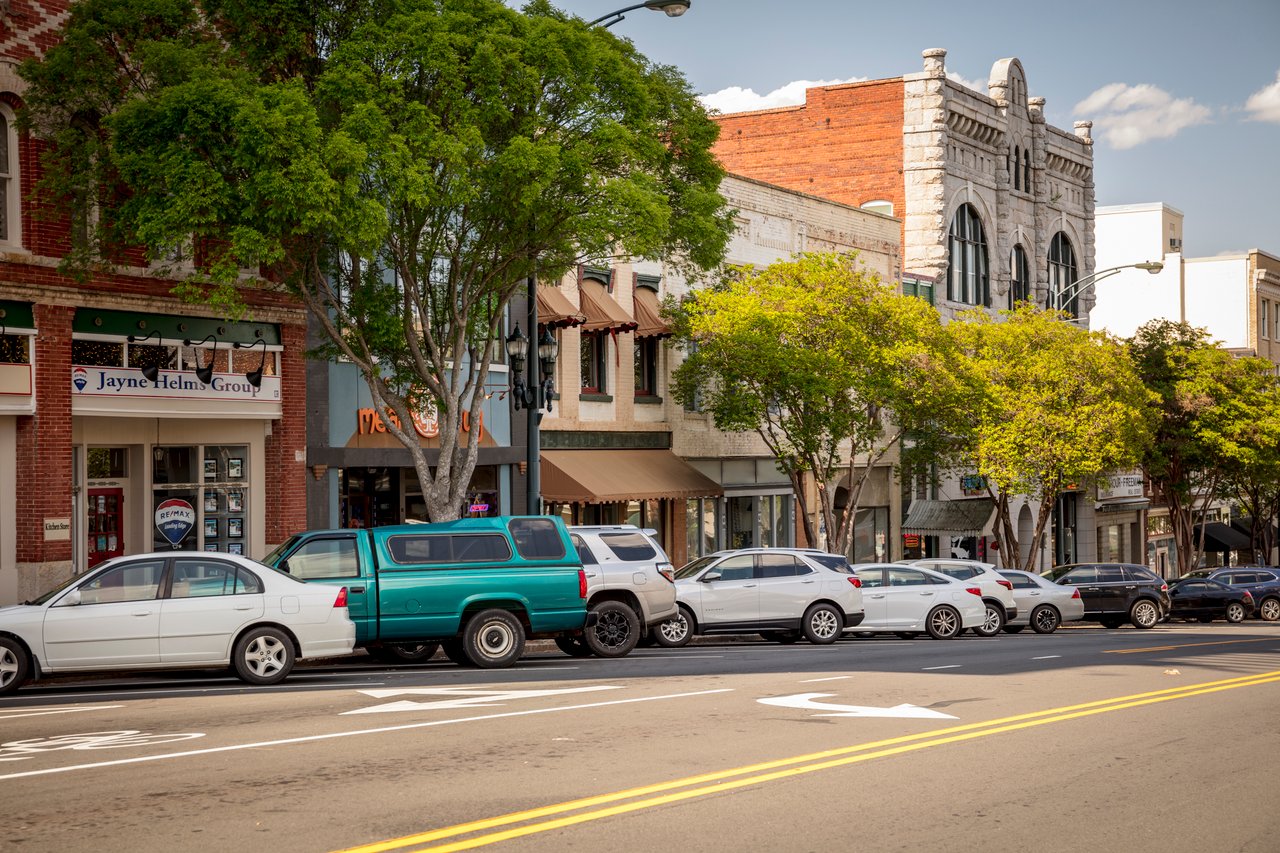
Living in South End means you’re never far from some of the city’s best dining, breweries, rooftop bars, boutique fitness studios, and art galleries. It’s a neighborhood that thrives on momentum—constantly evolving, yet grounded in a strong sense of community.
Looking to buy a home in South End? Let’s explore what this dynamic, design-forward neighborhood has to offer.
18,542 people live in South End, where the median age is 32 and the average individual income is $93,947. Data provided by the U.S. Census Bureau.
Total Population
Median Age
Population Density
Average individual Income
There's plenty to do around South End, including shopping, dining, nightlife, parks, and more. Data provided by Walk Score and Yelp.
Explore popular things to do in the area, including Kartez Cookies, Summit Coffee - Wilmore, and Mad Cakes CLT.
Name | Category | Distance | Reviews |
Ratings by
Yelp
|
---|---|---|---|---|
Dining | 3.18 miles | 7 reviews | 5/5 stars | |
Dining | 0.89 miles | 6 reviews | 5/5 stars | |
Dining | 2.18 miles | 6 reviews | 5/5 stars | |
Dining | 4.23 miles | 7 reviews | 5/5 stars | |
Shopping | 2.69 miles | 7 reviews | 5/5 stars | |
Shopping | 0.42 miles | 6 reviews | 5/5 stars | |
Active | 2.49 miles | 9 reviews | 5/5 stars | |
Active | 2.11 miles | 5 reviews | 5/5 stars | |
Active | 3.99 miles | 6 reviews | 5/5 stars | |
Active | 0.69 miles | 5 reviews | 5/5 stars | |
Active | 4.94 miles | 5 reviews | 5/5 stars | |
Beauty | 0.58 miles | 11 reviews | 5/5 stars | |
Beauty | 3.8 miles | 5 reviews | 5/5 stars | |
Beauty | 1.92 miles | 5 reviews | 5/5 stars | |
Beauty | 0.39 miles | 10 reviews | 5/5 stars | |
Beauty | 1.16 miles | 10 reviews | 5/5 stars | |
|
||||
|
||||
|
||||
|
||||
|
||||
|
South End has 10,919 households, with an average household size of 2. Data provided by the U.S. Census Bureau. Here’s what the people living in South End do for work — and how long it takes them to get there. Data provided by the U.S. Census Bureau. 18,542 people call South End home. The population density is 9,665.909 and the largest age group is Data provided by the U.S. Census Bureau.
Total Population
Population Density Population Density This is the number of people per square mile in a neighborhood.
Median Age
Men vs Women
Population by Age Group
0-9 Years
10-17 Years
18-24 Years
25-64 Years
65-74 Years
75+ Years
Education Level
Total Households
Average Household Size
Average individual Income
Households with Children
With Children:
Without Children:
Blue vs White Collar Workers
Blue Collar:
White Collar: